
Minitab Infographics and Illustrations
While working for Minitab, I’ve created multiple illustrations and infographics used for various purposes. Many were to assist sales in explaining products or value to potential customers, or intended to work with ebooks and documents.
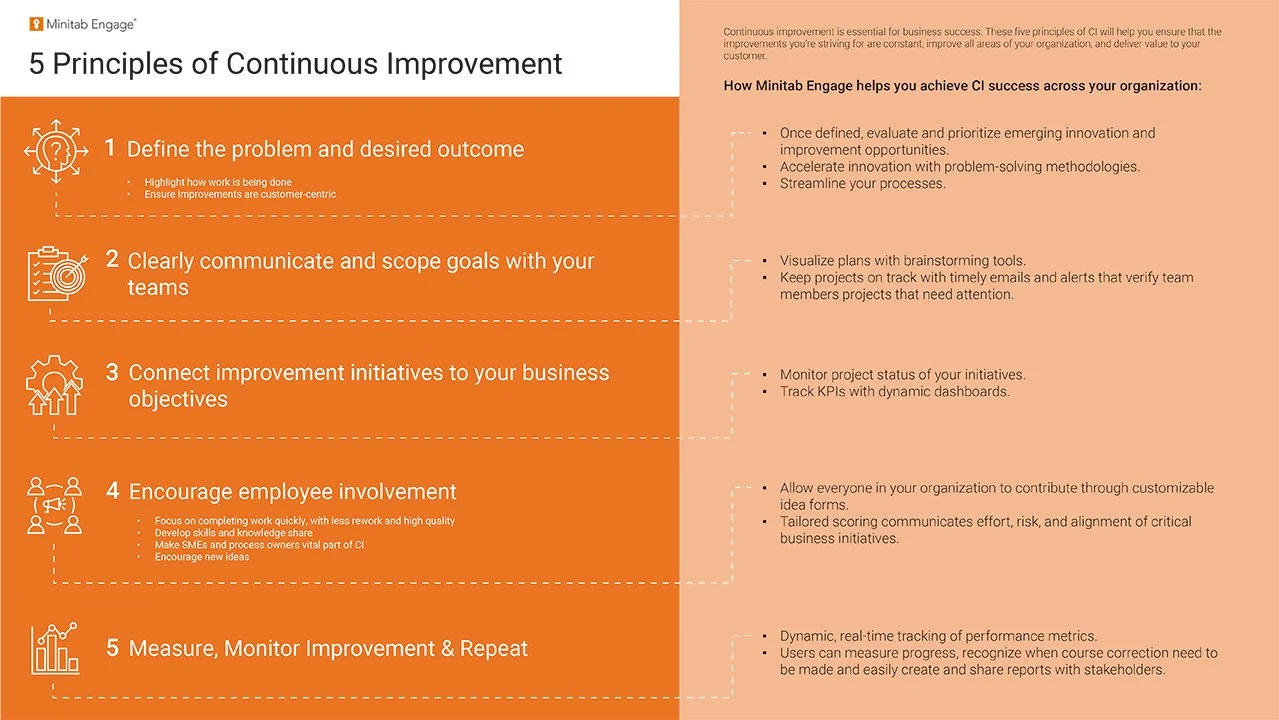
CI Infographic
This infographic is to explain how our product Minitab Engage can contribute to Continuous Improvement. It is intended to show prospective users how they can benefit from the software, to assist Sales in promoting Engage.

Healthcare Infographic
This infographic is to show the benefits of Minitab Engage in the Healthcare industry, and how it can help to improve programs. This was recreated for 8 different languages, and is being used in Minitab’s Europe and Asia markets, as well as the US.
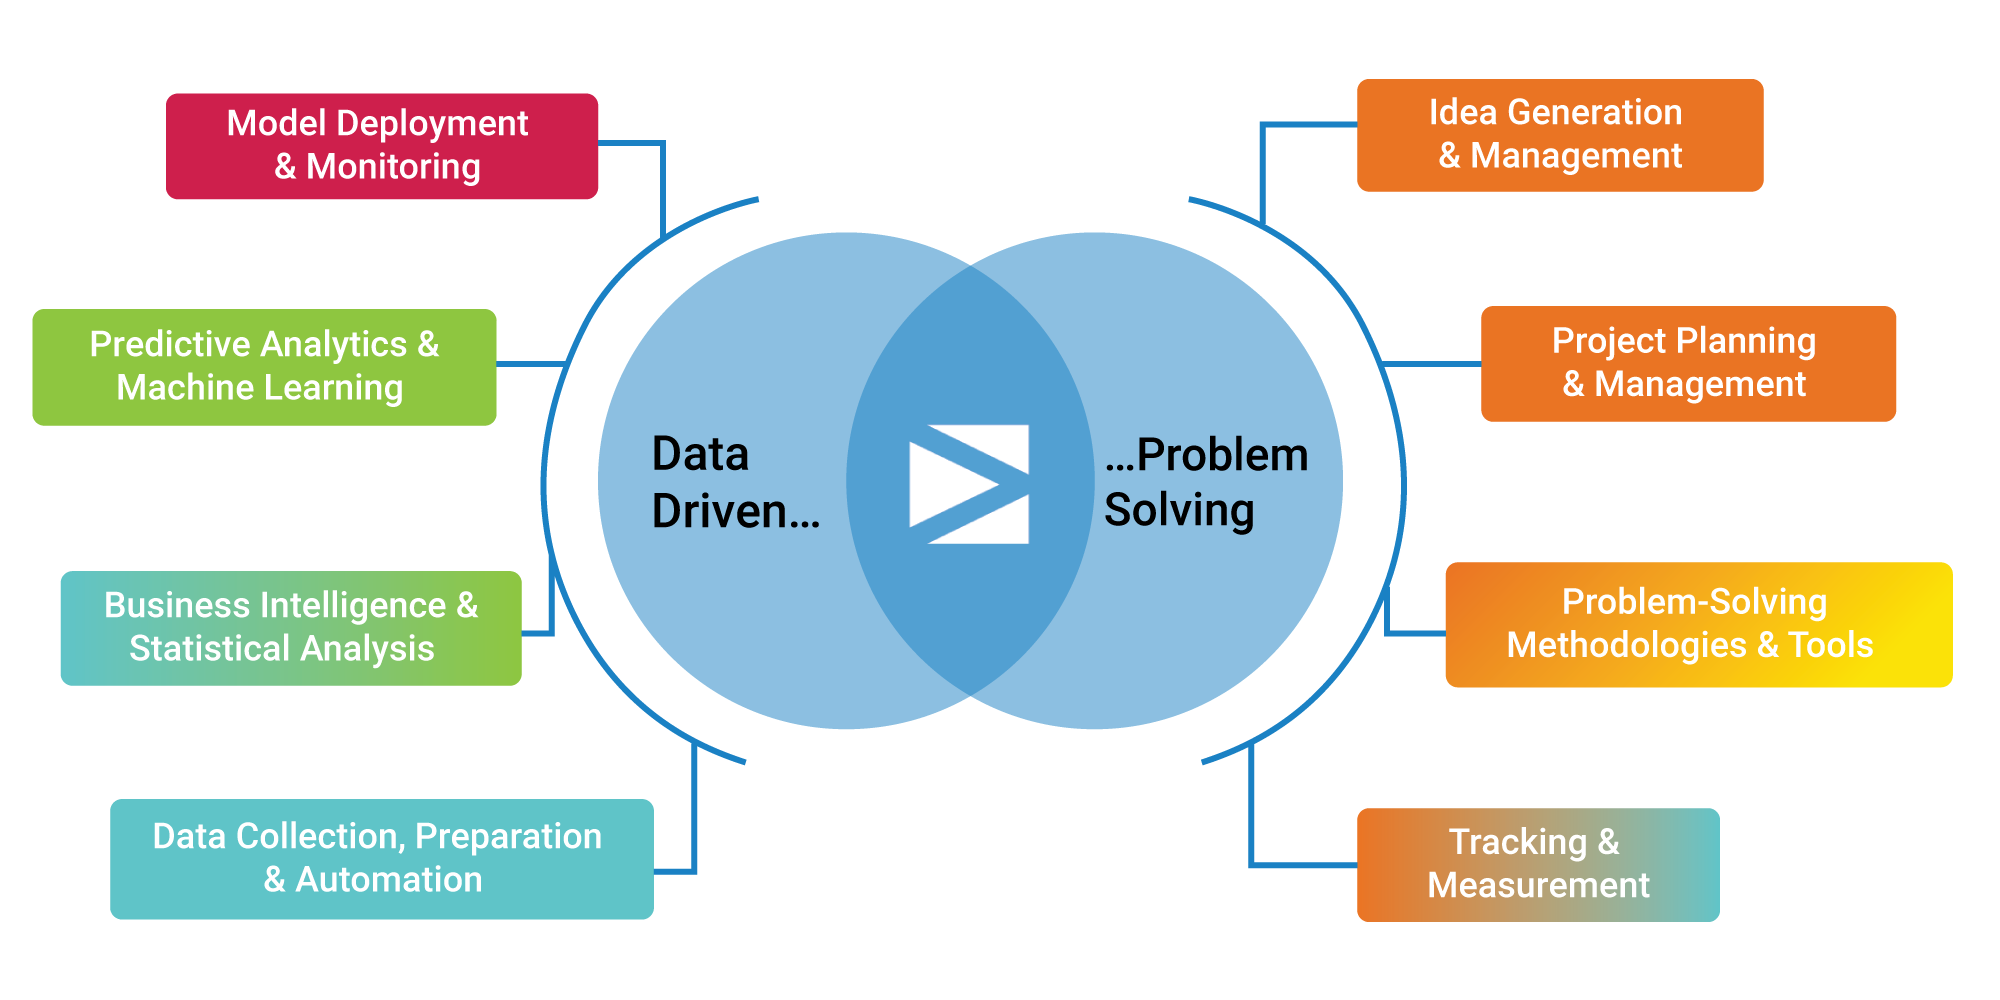
CI Illustration
Originally a Powerpoint slide, this illustration has evolved to be used across our website, in print collateral, and even in booth graphics for live trade shows. It breaks down how Minitab helps with Continuous Improvement, which is a very large concern for most users in the Analytics field.

Supply Chain Infographic
This infographic was created to assist in explaining how the Minitab software suite can help with supply chain struggles. The infographic has already been used to support sales in acquiring a Fortune 500 company as a new client.

R&D Infographic
This infographic is meant to assist in explaining how Minitab Connect can help with issues in Research and Development. It illustrates many of the common struggles many teams face, and how Connect specifically can solve these issues.